Did you know that it is estimated that SaaS businesses have a 20-30% loss in revenue due to operational efficiencies?
To put this in alarming perspective: For a Seed or Series A company, this could mean that if you are running at £20k MRR, this would be reduced to £14k. Your ARR would reduce from a possible £240k ARR to £168k. Very basic maths, but startling when you think about it!
How to stop this?
Bring in a RevOps person/team to help manage and effect change to this potential revenue loss, and ensure their effectiveness is measured. But how?
We have clearly defined what RevOps is, its purpose and the responsibilities it carries. This article is to focus on how and what gets measured to understand the department’s effectiveness. There are four critical metrics:
Value
This is more commonly known as the Average Contract Value (ACV). Taking the pulse of a business and its current ACV is a metric to be very concerned with, as well as how to raise this. This is one of the first ways a business can increase its net profits.
If all customers were to pay 5% extra, when extrapolated across the whole portfolio, what does that actually mean?
Volume
This is the number of deals in the pipeline. There will always need to be a sense check on these deals, especially if net new, to ensure that they align with the ICP of the business (this is something to check in the SDR > AE handover process when producing Sales Accepted Opportunities).
However, this needs to be considered alongside value. For example, the ACV of the deals could have gone from £25k to £15k in between quarters because you had entered a new market, but there are double the amount of deals. Look at these two together, not independently.
Velocity
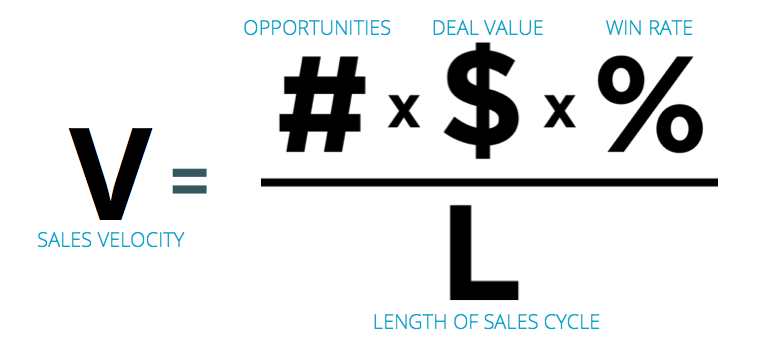
This is the measure of how much money is flowing through your pipeline on a daily basis. There is a nice formula for working out the velocity:

Improving the speed and therefore accelerating the revenue recognition of converting a stranger into a customer is what all SaaS companies are in business to achieve. This metric keeps eyes firmly on the prize.
Conversion rates
Perhaps an obvious one, but this is not just the SQL to Closed Won ratio, but conversion rates of all stages. Understanding how many proposals it takes to get a win, how many demos it takes to get one proposal, and how many discovery calls it takes to get one demo (etc.,) is the key to understanding where some efficiency gains can be achieved.
For example, think what the difference to your pipeline could be if you increase your win rate from 25% to 33%.